The Mid-Term Rental Analytics Platform

Research any U.S. market, view real 30+ night comparables, find demand drivers with contact info, underwrite deals, and optimize your listings — all in one platform built for mid-term rentals.

TR Analytics platform showing the MTR Analyzer with tabbed navigation for Overview, MTR Comparables, Market Intelligence, Opportunities, Regulations, and Properties for Sale — displaying market classification, investment verdict, and revenue by unit type for Syracuse, New York

Mid-term rental analysis tools in one place

Our platform helps you research markets, find and evaluate properties, and improve listing performance using real mid-term rental data and AI-powered analysis.

MTR Comparables

View real 30+ night rental comparables with monthly rent, occupancy, and revenue — filter, map, and select comps to estimate your nightly rate.

Market Intelligence

Get a full market picture — AI investment verdict, pricing bands, BLS employment data, Census demographics, amenity ROI, regulations, and seasonal trends.

Demand Drivers

See which hospitals, universities, and employers drive mid-term rental demand near your property — with contact information to build direct relationships.

Deal Finder & Analyzer

Search properties for sale in any market, see estimated MTR revenue, then underwrite the deal with full financial projections and an AI-powered deal score.

Listing Optimizer

Optimize your titles, descriptions, amenities, and photos using AI trained to evaluate mid-term rental listings for 30+ night guests.

Features

See how each feature helps you research, find, evaluate, and optimize mid-term rental opportunities.

Real mid-term rental comparables — not estimates

MTR Comparables shows you what properties actually rent for on a 30+ night basis in any U.S. market. Every comp includes real monthly rent, occupancy rates, and revenue — sourced from active mid-term rental listings, not extrapolated from short-term rental averages or national benchmarks.

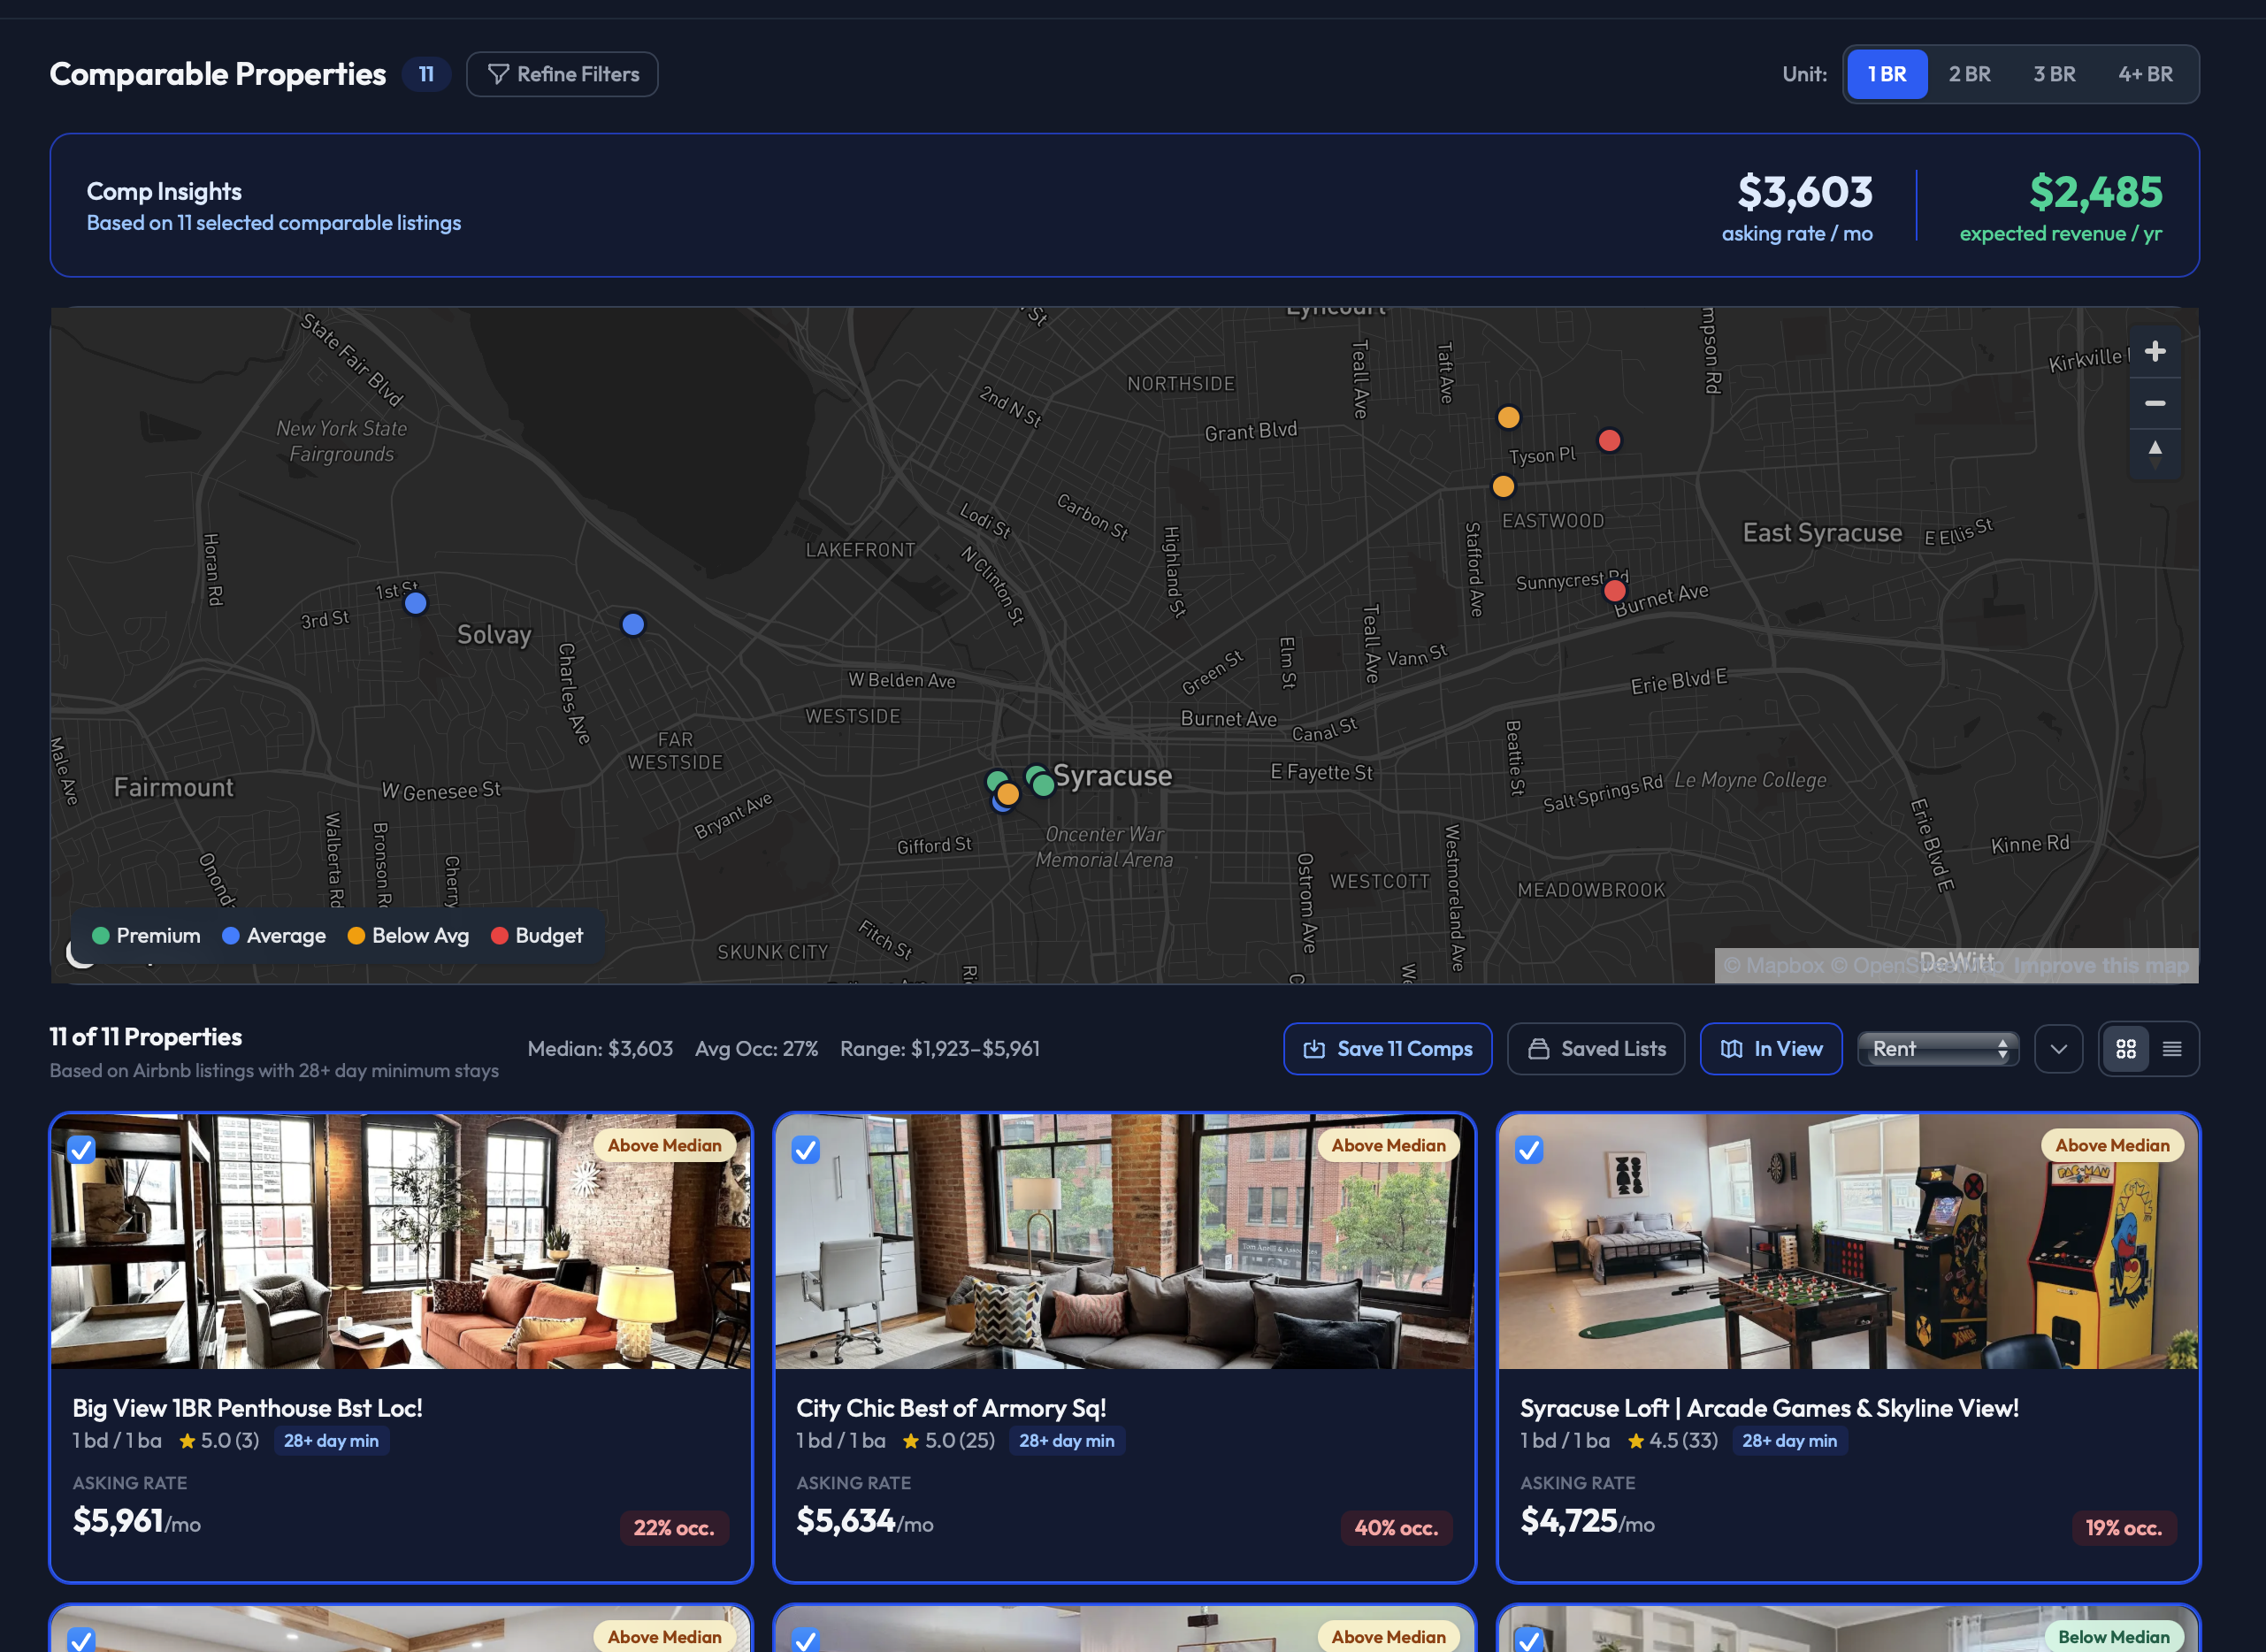
Real 30+ night pricing with monthly rent, occupancy rate, and monthly revenue for every comparable property

Advanced filtering by bedroom count, room type, baths, max guests, and amenities

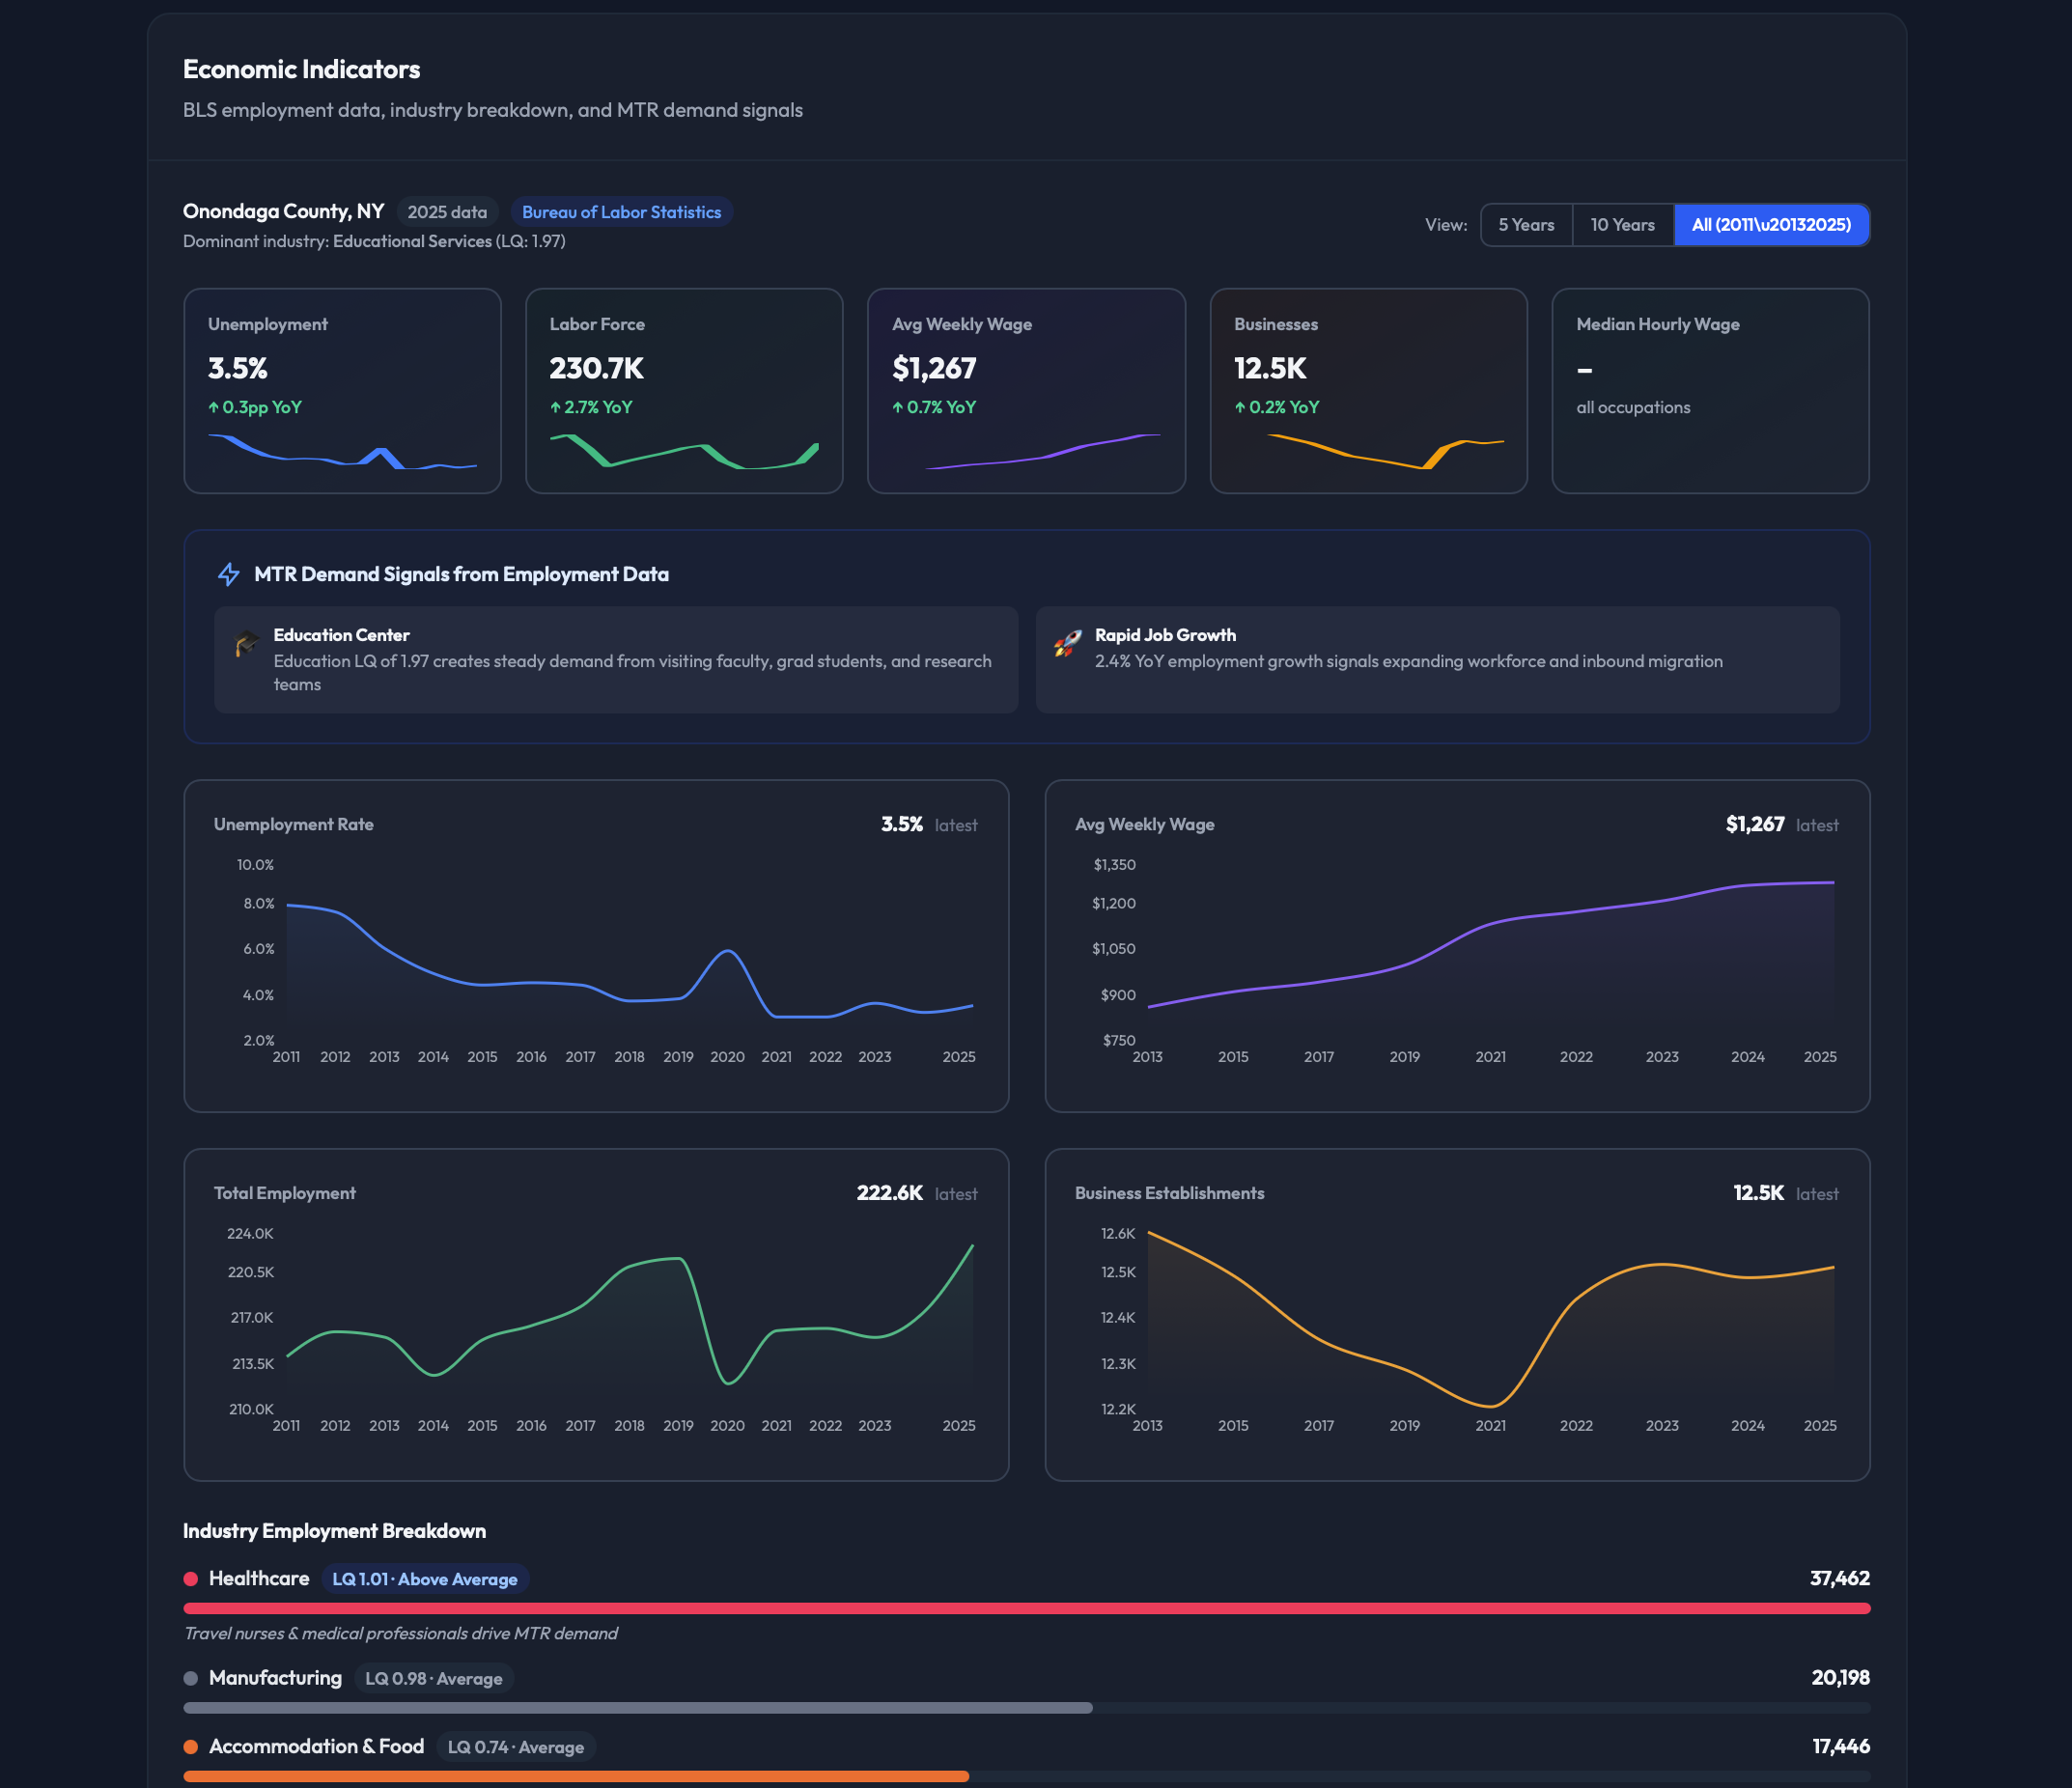
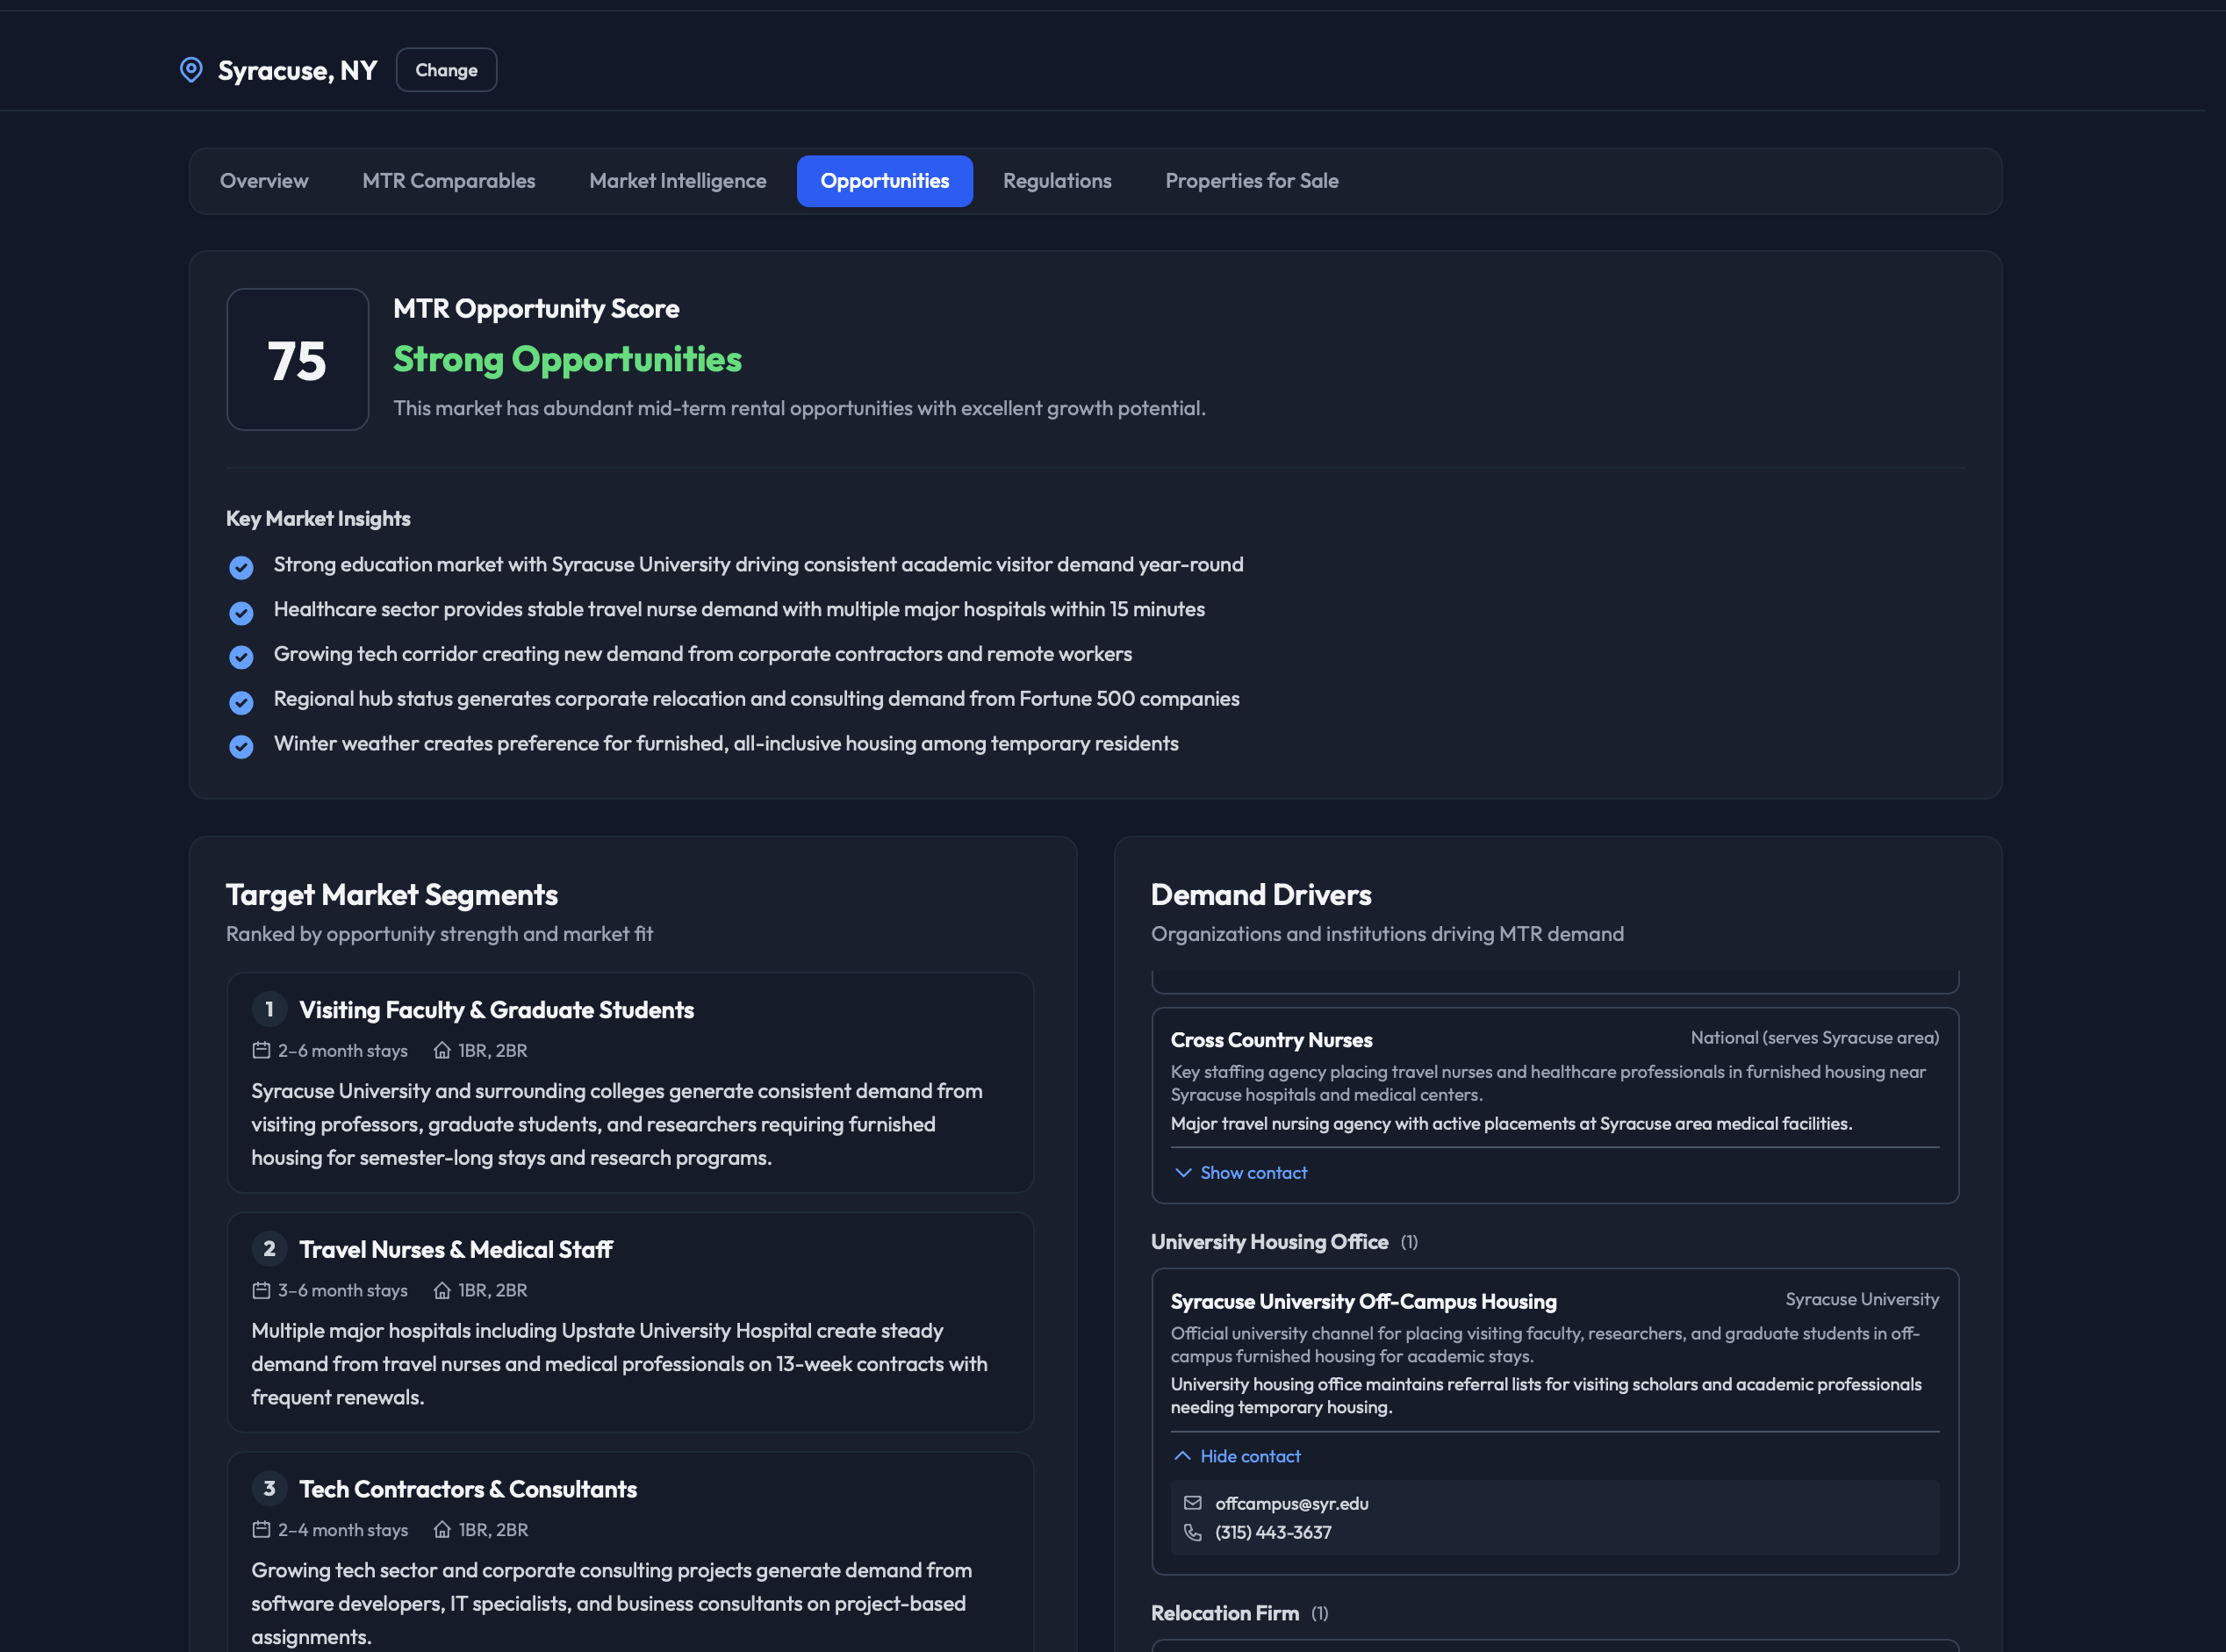
MTR Opportunity Score with demand drivers — hospitals, universities, corporate relocations, and major projects

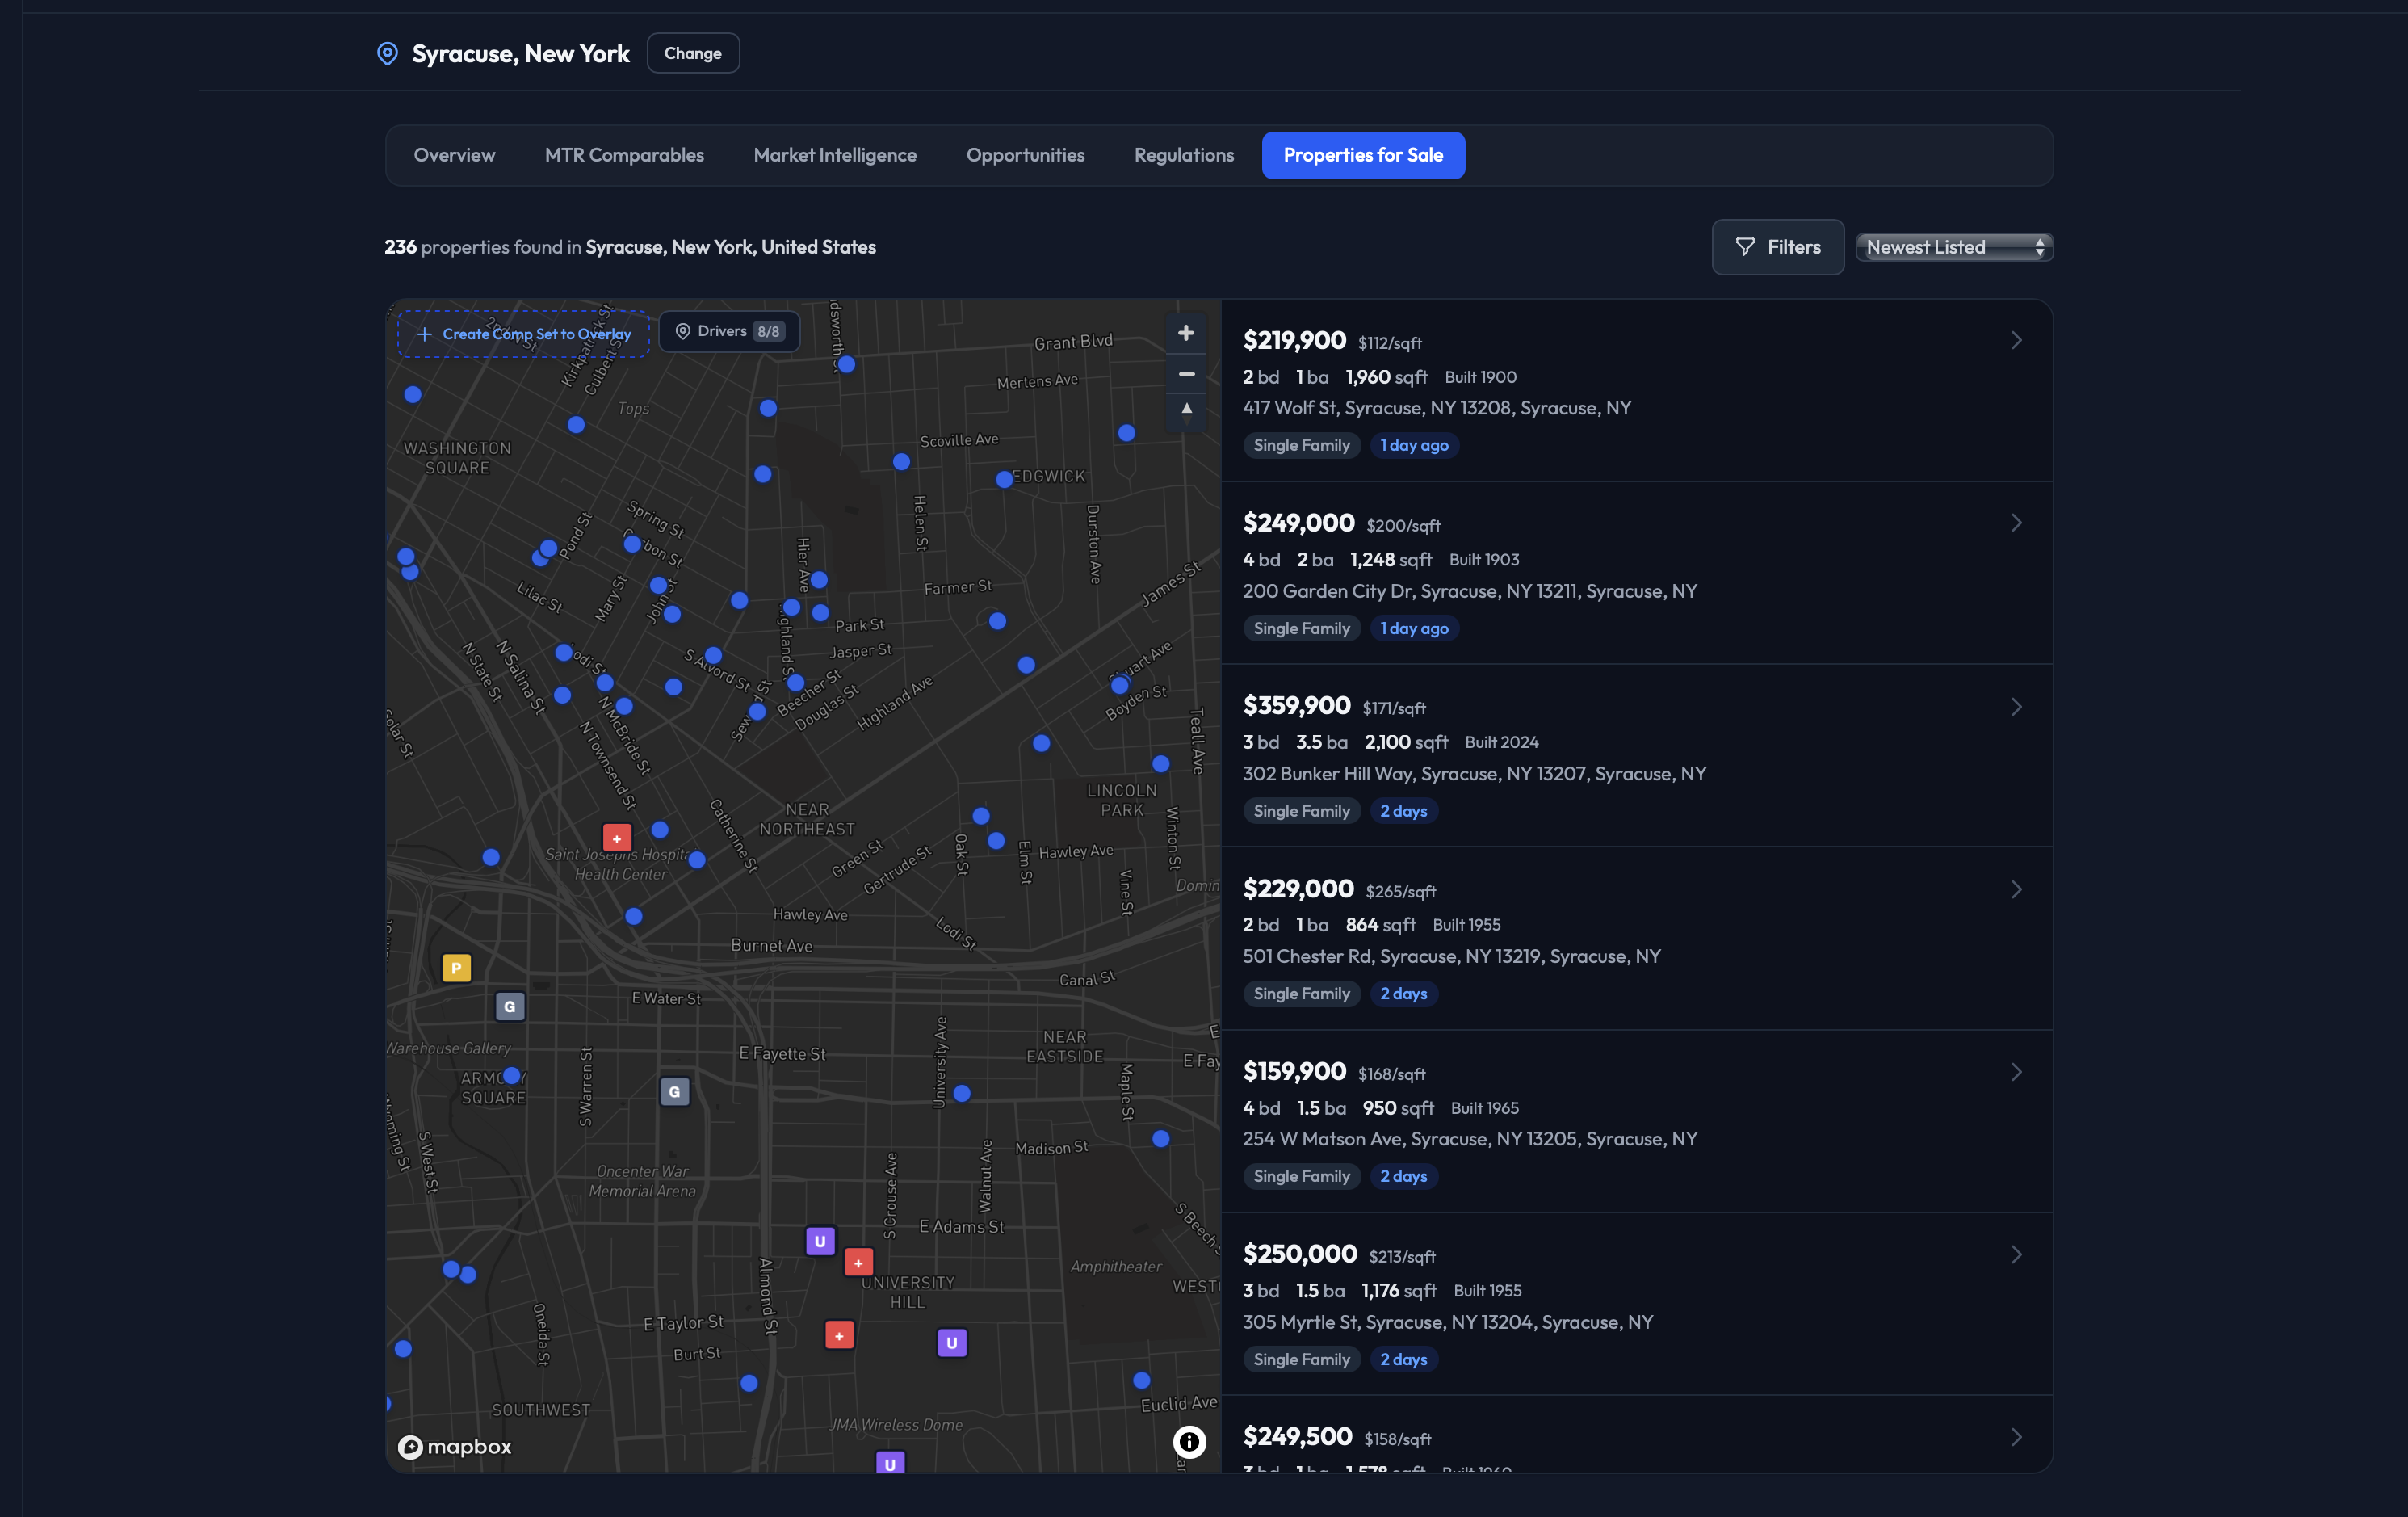
Interactive map view showing comp locations relative to your subject property

Select specific comps to calculate your estimated monthly rent based on the properties most similar to yours

Save and manage comp lists to track your favorite comparables across markets

Deep property detail including trailing-twelve-month revenue, RevPAR, last-90-day metrics, host info, amenities, and listing URL

Try MTR Comparables
MTR Analytics Market Intelligence tab displaying BLS employment data by industry, Census demographic trends with population growth and income charts, pricing band distribution, and an AI-generated market investment verdict

The full picture of any mid-term rental market

Market Intelligence combines an AI-generated investment verdict with real economic data so you can evaluate a market with confidence. Every analysis pulls from the Bureau of Labor Statistics, U.S. Census Bureau, and active mid-term rental activity — not crowdsourced estimates or national averages.

AI investment verdict — a clear strong, moderate, or cautious recommendation with market classification and positioning (hidden gem, emerging, saturated)

Pricing bands and recommended ranges based on actual 30+ night rental activity in the target ZIP code

BLS employment data broken down by industry with employment trends over time

Census demographic trends including population growth, median income vs. rent, renter share, and housing supply

Amenity ROI analysis showing which amenities drive higher revenue and by how much

Booking window and stay length analysis with median lead times, seasonality patterns, and demand timing

Local regulation assessment covering licensing requirements, compliance rules, and short-term vs. mid-term rental restrictions

Try Market Intelligence

Find who needs housing — and how to reach them

The Opportunities tab identifies the institutions that generate mid-term rental demand in any market — hospitals staffing travel nurses, universities housing visiting faculty, employers relocating workers, and major construction projects bringing temporary crews. Every demand driver includes contact information so you can build relationships before your competitors even know the demand exists.

Demand drivers identified by type — hospitals, universities, employers, government facilities, and major projects — with proximity to your target area

Contact information for each demand driver so you can reach staffing agencies, housing offices, and relocation coordinators directly

MTR Opportunity Score from 0 to 100 that ranks a market's overall mid-term rental potential

Project timelines showing upcoming construction, infrastructure, and corporate developments with start and end dates, phase, and impact assessment

Top opportunities ranked with typical stay durations, ideal unit types, and market-specific summaries

Segments served for each driver — travel nurses, corporate relocations, visiting faculty, insurance displacement, and more

Try Demand Drivers
MTR Analytics Opportunities tab showing demand drivers including hospitals, universities, and employers with contact information, an MTR Opportunity Score of 78 out of 100, and a project timeline with upcoming construction and corporate developments
MTR Analytics Deal Finder showing a map view of properties for sale with pricing overlays, and Deal Analyzer displaying monthly cash flow projections, cap rate, cash-on-cash return, effective gross income, operating expenses, and an AI-generated deal score for a mid-term rental investment property

Find properties for sale and underwrite the deal

Deal Finder searches properties currently for sale in your target market and enriches each listing with estimated mid-term rental revenue and demand driver proximity. When you find one worth a closer look, open Deal Analyzer to input your purchase price, financing terms, and operating expenses — and get a full underwriting powered by real market data from the same ZIP code.

Properties for sale pulled from real listing data with price, beds, baths, square footage, year built, and days on market

Estimated monthly MTR revenue and gross yield for each property based on comparable rental data in the area

Nearest demand drivers shown with distance so you can evaluate proximity to hospitals, universities, and employers

Map and list views with advanced filters — price range, bedrooms, property type, lot size, and more

Full financial underwriting with cash flow, cap rate, cash-on-cash return, NOI, and MTR revenue premium vs. traditional long-term rent

Map and list views with advanced filters — price, beds, property type, and more

Try Deal Finder

Get more bookings from 30+ night guests

Listing Optimizer reviews your mid-term rental listing end-to-end — title, description, photos, amenities, and nearby places — and gives you an overall letter grade with the highest-impact improvements to make first. Every recommendation is generated by AI trained specifically for mid-term rental search behavior and booking patterns.

Listing content rewritten for mid-term rental search intent — three optimized title and description options to choose from

Photo analysis using AI vision — quality scoring, duplicate detection, and a recommended photo sequence that puts your strongest images first

Amenity recommendations based on how 30+ night guests actually filter and compare listings

Nearby places integration — local hospitals, grocery stores, coffee shops, and entertainment woven into your optimized description

Overall letter grade from A to F with a prioritized checklist of what to improve first

Target traveler profile showing demand breakdown across business travelers, medical professionals, relocations, and more

Try Listing Optimizer
MTR Analytics Listing Optimizer showing AI-generated photo analysis with quality scores and reorder recommendations, rewritten listing titles and descriptions, amenity scoring, nearby places integration, and an overall B-plus letter grade for a mid-term rental property

Save time and make smarter mid-term rental decisions.

MTR Analytics consolidates market research, property sourcing, deal underwriting, and listing optimization into one platform — so you can spend less time on spreadsheets and more time building your portfolio.

All Your Research in One Place

Stop switching between Airbnb, AirDNA, Furnished Finder, Census.gov, and spreadsheets. Market pricing, real comparables, demand drivers, employment data, regulations, and properties for sale — one dashboard, one search.

Powered by Real Market Data

Pricing bands, comparables, and occupancy rates sourced from actual 30+ night rental activity. Employment data from the Bureau of Labor Statistics. Demographics from the U.S. Census Bureau. Not estimates. Not national averages.

AI-Driven Analysis

Every market verdict, opportunity score, deal recommendation, and listing grade is generated by AI calibrated specifically for mid-term rental performance — not a repurposed short-term rental model.

Frequently Asked Questions

Everything you need to know about mid-term rental analytics.

Mid-term rental analytics is the process of researching markets, pricing, demand, and regulations for properties rented on a 30+ night basis — typically to travel nurses, corporate relocators, visiting faculty, and insurance displacement tenants. MTR Analytics automates this research by combining real rental comparables, federal employment and demographic data, demand driver identification, and AI-powered analysis into one platform.
MTR Analytics pulls from multiple real-world data sources including active mid-term rental listings (30+ night stays), the Bureau of Labor Statistics for employment data by industry, the U.S. Census Bureau for demographic and economic trends, and real estate listing databases for properties currently for sale. All comparables and pricing data reflect actual mid-term rental activity — not short-term rental estimates or national averages.
The Opportunities tab identifies institutions that generate mid-term rental demand in any U.S. market — hospitals, universities, employers, government facilities, and major construction projects. Each demand driver includes proximity data and contact information sourced through AI-powered research and location intelligence, so you can reach staffing agencies, housing coordinators, and relocation managers directly.
Yes. Enter any city or ZIP code and the platform identifies nearby hospitals and healthcare systems, estimates the travel nurse demand they generate, and provides contact information for staffing and housing offices. The MTR Opportunity Score also factors in healthcare demand alongside other mid-term rental drivers.
AirDNA focuses primarily on short-term rentals (nightly stays). MTR Analytics is built specifically for mid-term rentals — stays of 30 nights or more. Our comparables, pricing bands, and occupancy data reflect actual 30+ night rental activity. We also provide demand driver identification with contact info, BLS employment data, Census demographics, deal underwriting, and AI-powered listing optimization — capabilities that short-term rental analytics platforms do not offer.
Deal Analyzer lets you underwrite a specific property as a mid-term rental investment. Input your purchase price, financing terms, and operating expenses, and the platform calculates cash flow, cap rate, cash-on-cash return, NOI, and the MTR revenue premium compared to traditional long-term rent. An AI-generated deal score from 0 to 100 gives you a clear buy or pass recommendation. You can save deals to your portfolio and share analyses with partners via a public link.
Upload or connect your mid-term rental listing, and the AI reviews your title, description, photos, amenities, and nearby places. You get an overall grade from A to F, three rewritten title and description options, photo quality scores with a recommended image sequence, amenity recommendations, and a prioritized list of improvements. All recommendations are calibrated for how 30+ night guests search and compare listings.
Yes. You can get started for free with no credit card required. The free trial gives you access to the full platform so you can evaluate it with your own markets and listings before committing to a paid plan.

Start analyzing mid-term rental markets today.

Enter any U.S. city or ZIP code and get real comparables, market intelligence, demand drivers, and an AI-powered investment verdict in minutes. No credit card required.